
BNB price continued climbing this week as bulls attempted to confirm a breakout above a key neckline resistance zone, with a bullish double bottom structure on the daily chart signaling the potential for a larger upside move toward the $750 region.
Summary
- BNB price climbed toward the key $680–$690 neckline resistance as a bullish double bottom pattern signaled potential upside toward $750–$780.
- Growing optimism around spot BNB ETF proposals and rising institutional activity on BNB Chain helped strengthen investor sentiment.
- CoinGlass data showed rising open interest and positive funding rates, signaling that traders continue building bullish positions on BNB.
According to data from crypto.news, BNB (BNB) price traded around $687 at press time on May 15 after briefly rallying above $690 earlier in the session. The token has now recovered nearly 18% from its April lows near $580 as sentiment surrounding the Binance ecosystem continued improving.
BNB’s latest rally appears to have been fueled by a combination of institutional, ecosystem, and regulatory catalysts unique to the token.
One of the biggest drivers remains growing market optimism surrounding pending spot BNB ETF proposals tied to asset managers seeking broader institutional exposure to the token. Investor sentiment also strengthened after the recently launched leveraged Teucrium 2x Long Daily BNB ETF continued attracting attention from traditional market participants looking for amplified exposure to Binance Coin.
At the same time, BNB Chain has continued expanding its role within the tokenized real-world asset sector. Recent integrations involving institutional tokenization initiatives and stablecoin infrastructure on the network have reinforced expectations that BNB Chain could become a larger player in blockchain-based financial settlement systems.
The network has also benefited from improving on-chain activity in recent weeks. Decentralized exchange volumes, stablecoin transfers, and BNB Chain ecosystem participation have all shown signs of recovery alongside the broader crypto market rebound.
Meanwhile, investor sentiment toward Binance itself has improved modestly after months of pressure tied to U.S. regulatory and compliance scrutiny earlier this year. The fading intensity of those concerns appears to have helped reduce bearish pressure on BNB during the latest recovery phase.
Derivatives positioning has additionally turned increasingly bullish. CoinGlass data showed rising open interest and positive funding rates over recent sessions, signaling that traders continue building long exposure as momentum strengthens.
BNB price analysis
On the daily chart, BNB appears to be forming a bullish double bottom pattern with two major lows established near the $580 support region over the past several months.
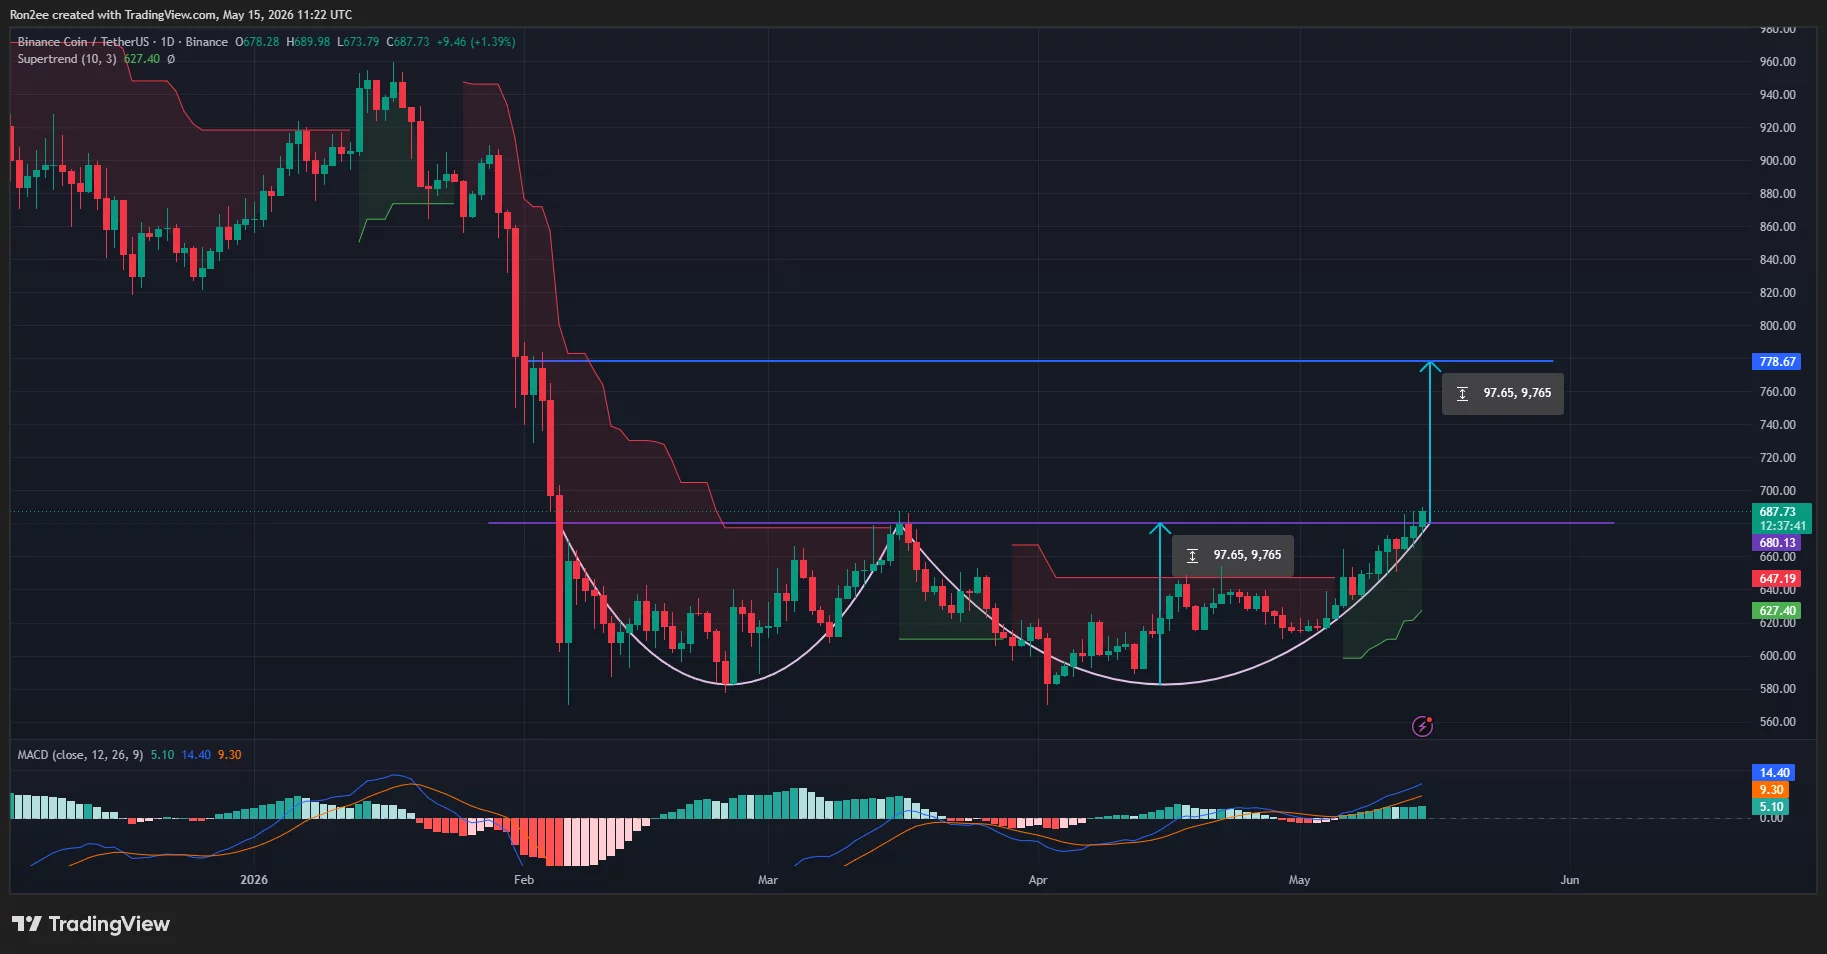
The neckline of the pattern sits near the $680–$690 resistance zone, which bulls are currently attempting to reclaim decisively. A confirmed breakout above the neckline would validate the pattern and could potentially trigger a measured move toward the $780 region by adding the height of the formation to the breakout level.
The current setup also shows BNB gradually reclaiming higher lows while continuing to trade firmly above the Supertrend indicator near the $627 region, signaling that buyers currently maintain broader trend control.
Momentum indicators continue to support the bullish outlook. The MACD recently completed a bullish crossover while the histogram continues printing expanding green bars, suggesting upside momentum remains intact despite short-term consolidation below resistance.
Meanwhile, the broader recovery structure remains constructive as long as BNB holds above the key $650 support zone. A successful breakout above the neckline resistance could strengthen momentum toward the psychological $700 level, followed by the $750–$780 region.
However, failure to hold above current support levels could weaken the bullish setup and potentially trigger a pullback toward the $627 and $600 support zones, where buyers previously reentered aggressively.
Disclosure: This article does not represent investment advice. The content and materials featured on this page are for educational purposes only.
